
Learn how the wolf count and territory size are determined. Featuring a "reprint" of the 2022 Minnesota Wolf Population Update from the DNR, authored by John Erb and Carolin Humpal of the Forest Wildlife Populations and Research Group.
Since the late 1970’s, Minnesota has monitored its statewide wolf population using an approach that combines attributes of territory mapping with an ad hoc approach to determine the total area of the state occupied by wolf packs. The methods employed have changed only slightly during this time. Initially, surveys were conducted at approximately 10-year intervals (1978, 1988, 1997), thereafter at approximately 5-year intervals (2003, 2007, 2012). Results indicated a geographically and numerically expanding population through the 1997-98 survey, with little geographic expansion from 1998 to 2007 (Erb and DonCarlos 2009). These results were generally consistent with separate wolf population trend indicators (annual scent station survey, winter track survey, and number of verified depredations) in Minnesota.
In 2012, wolves in the Western Great Lakes Distinct Population Segment were removed as a listed species under the federal Endangered Species Act. The de-listing coincided with the normally scheduled (every 5th year) wolf survey as well as survey timeline specifications in the Minnesota Wolf Management Plan (i.e., first and fifth year after delisting; Minnesota Department of Natural Resources 2001). The 2012-13 survey (Erb and Sampson 2013) concluded that overall wolf range had expanded along its south and west edge, but with only minor change in the total amount of land occupied by wolf packs; similar patterns were found 5 years later as part of the winter 2017-18 survey (Erb et al. 2018).
After federal de-listing in 2012, wolf harvest seasons were established and population surveys have been conducted annually to better inform annual management decisions. In the first three winters after de-listing, wolf population point estimates varied from approximately 2,200 to 2,400 (Erb et al. 2014). In December 2014, following the third consecutive wolf harvest season, a court ruling returned wolves in Minnesota to the list of federally threatened species. Since that time, wolf surveys have continued on an annual basis. Herein we provide an update of population status from the 2021-22 winter survey.
The methodology used to estimate wolf population size in Minnesota utilizes three primary pieces of information: 1) an estimate of the total area of land occupied by wolf packs; 2) an estimate of average wolf pack territory size; and 3) an estimate of average mid-winter pack size. It is likely that occupied range changes on a comparatively slow timescale compared to fluctuations in average territory and pack size. As such, occupied range is estimated at approximately 5 year intervals, with the last being during winter 2017-18; we assume that occupied range has remained unchanged (i.e., 73,972 km2; Erb et al. 2018) and use that in our population calculations for winter 2021-22.
To track pack movements, we and various collaborators captured wolves using foothold traps (LPC # 4, LPC #4 EZ Grip, or LPC #7 EZ Grip) approved as part of research conducted under the Association of Fish and Wildlife Agencies Best Management Practices for trapping program. Some wolves are also captured with the use of live-restraining neck snares (Gese et al. 2019), and a few by helicopter dart-gun. Wolves were typically immobilized using a mixture of either Ketamine:Xylazine or Telazol:Xylazine. After various project-specific wolf samples and measurements were obtained, an antagonist (Yohimbine or Atipamezole) and an antibiotic were typically administered to all animals prior to release. Various models of tracking collars were deployed depending on study area and collar availability. Most GPS collars were programmed to take 3-6 locations per day, and wolves fitted with VHF-only collars were relocated at approximately 7- to 10-day intervals throughout the year, or in some cases, primarily from early winter through spring.
To estimate average territory size, we delineated territories of collared packs using minimum convex polygons (MCP) for consistency with previous surveys. Prior to delineating wolf pack territories, we removed ‘outlier’ locations using the following guidelines, though subjective deviations were made in some cases as deemed biologically appropriate: 1) for wolves with approximately weekly VHF locations only, locations > 5 km from other locations were excluded as extraterritorial forays (Fuller 1989); 2) for GPS collars that provided temporally fine-scale movement information, we removed obvious movement paths if the animal did not travel to that area on multiple occasions and if use of the path would have resulted in inclusion of obviously unused areas in the MCP; and 3) for consistency with the way in which the data is used (i.e., to estimate number of packs), locations that result in notable overlap with adjacent territories are removed.
In past surveys where all or the majority of territories were delineated using comparatively few VHF locations, raw territory sizes were increased 37% to account for the average amount of interstitial space between delineated wolf pack territories, as estimated from several Minnesota studies (Fuller et al. 1992:50) where the number of VHF locations per pack typically averaged 30-60. Interstitial spaces are a combination of small voids created by landscape geometry and wolf behavior, but can also be an artifact of territory underestimation when there are fewer locations. Hence, for packs with < 100 locations (n = 7; mean number of locations = 41), we multiplied each estimated territory size by 1.37 as in the past. For packs with > 100 locations (n = 33; mean number of locations = 2,748), territories were assumed to be fully delineated and not re-scaled.
To estimate average mid-winter pack size, collared wolves were repeatedly located via aircraft during winter to obtain visual counts of pack size. In cases where visual observations were limited, we also rely on any estimates of pack size based on tracks observed in the snow and trail camera images from within the pack’s territory. If any reported count produced uncertain estimates (e.g., 4 to 5 wolves), we used the lower estimate. Overall, counts are assumed to represent minimum known mid- winter pack size.
The estimated number of packs within occupied wolf range is computed by dividing the area of pack- occupied range by average scaled territory size. The estimated number of packs is then multiplied by average mid-winter pack size to produce an estimate of pack-associated wolves, which is then divided by 0.85 to account for an estimated 15% lone wolves in the population (Fuller et al. 1992:46, Fuller et al. 2003:170). Specifically, N = ((km2 of occupied range/mean scaled territory size)*mean pack size)/0.85.
Using the accelerated bias-corrected method (Manly 1997), the population size confidence interval (90%) was generated from 9,999 bootstrapped re-samples of the pack and territory size data and does not incorporate uncertainty in estimates of occupied range or percent lone wolves. For purposes of discussion, we base our informal assessments of significant differences in results across years on visual comparison of the degree of confidence interval overlap (Cumming and Finch 2005).
Pack and Territory Size
We obtained data on 40 packs that were monitored during all or part of the survey period (April 2021 to April 2022). Both territory and winter pack size data were available from 37 marked wolf packs.

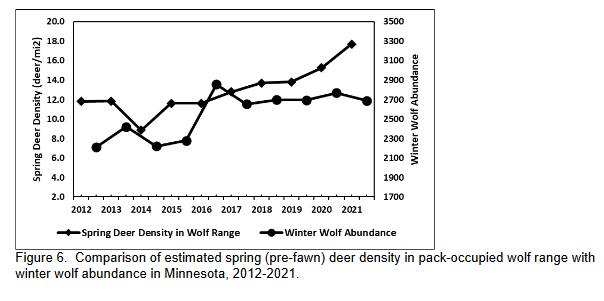
A land cover comparison using the 2019 National Land Cover Database suggests that land cover in territories of collared packs closely reflected habitat in overall occupied wolf range, with some under- representation of agricultural cover types in collared pack territories (Table 1). Using spring 2021 deer density data (MNDNR, unpublished data) for deer hunting permit areas, weighted by number of radio-collared wolf packs in a permit area, we estimate an average of approximately 14.4 deer/mi2 (pre-fawn) in territories of radio-marked packs during spring 2021. In comparison, 2021 spring deer density for the entirety of occupied wolf range, weighted by permit area and excluding permit areas within which a majority of the area is not considered pack-occupied, was approximately 17.7 deer/mi2.
 .
.
Similar to changes in average territory size but with an opposite effect on the abundance estimate, the point estimate for average winter pack size, after declining the past 2 years, increased 21% back to a level near other post-2011 estimates (Figure 3). Average winter pack size in 2021-22 was estimated to be 4.59 (range = 2 – 9).

With an average territory size of 148 km2 and assuming that occupied range has not changed since the 2017-18 survey (73,972 km2; Erb et al. 2018), we estimate a total of 498 wolf packs in Minnesota during winter 2021-22 (Figure 4). Although also influenced by the estimated amount of occupied range, trends in the estimated number of packs are inversely correlated with trends in estimated territory size (i.e., for a given amount of occupied range, increases in average territory size yield lower estimates of the number of packs within the state).

After accounting for the assumed 15% lone wolves in the population, we estimate the 2021-22 mid- winter wolf population to be 2,691 wolves, or 3.6 wolves per 100 km2 of occupied range. The 90% confidence interval was approximately +/- 500 wolves, specifically 2,173 to 3,240. Given the nearly complete overlap with the 2020-21 confidence interval, we conclude that the 2021-22 statewide wolf population size was unchanged from the previous winter, but with fewer and larger packs occupying larger territories compared to the past 2 winters.

From spring 2020 to spring 2021, average weighted deer density within pack-occupied wolf range increased 16%, though with much spatial variability (17% decline to 50% increase) across permit areas. Due to periodic recalibration or changes to deer modeling methods, the relationship between estimated wolf and deer trends may have time-varying degrees of uncertainty and should be treated with caution, but over the past 11 years the trend in winter wolf population size has been positively correlated with average deer density within wolf range the preceding spring (Figure 6).
We thank the USDA Wildlife Services program (John Hart, Rick Olson, LaRae Roseen, Dave Hughley, Kevin Fuller, and Jeff Grabarkewitz) and Barry Sampson for assistance with capturing and collaring wolves, and several DNR pilots for their critical monitoring contributions. Special thanks to numerous collaborators for their assistance or sharing of wolf monitoring data utilized in this survey, including Dave Mech and Shannon Barber-Meyer (USGS), Steve Windels (Voyageurs National Park), Tom Gable, Austin Homkes, and Joseph Bump (U. of Minnesota), Jay Huseby, Dave Price, and Sarah Ruffing (Red Lake Band of Chippewa), Seth Moore and EJ Isaac (Grand Portage Band of Chippewa), Mike Schrage, Lance Overland, Terry Perrault, John Goodreau, Matt Weske, Sam Johnson, and Jeff Reynolds (Fond du Lac Resource Management Division), and Morgan Swingen (1854 Treaty Authority). This project was funded in part by the Wildlife Restoration Program (Pittman- Robertson).
Original PDF can be seen here.
Cumming, G., and S. Finch. 2005. Inference by eye: confidence intervals and how to read pictures of data. American Psychologist 60:170–180.
Erb, J., and M. DonCarlos. 2009. An overview of the legal history and population status of wolves in Minnesota. Pages 49-64 in A. P. Wydeven, T. R. Van Deelen , and E. J. Heske, editors.
Recovery of gray wolves in the Great Lakes Region of the United States: an endangered species success story. Springer. New York, New York.
Erb, J., and B. Sampson. 2013. Distribution and abundance of wolves in Minnesota, 2012-13.
Minnesota Department of Natural Resources, St. Paul.
Erb, J., C. Humpal, and B. Sampson. 2014. Minnesota wolf population update 2014. Minnesota Department of Natural Resources, St. Paul.
Erb, J., C. Humpal, and B. Sampson. 2018. Distribution and abundance of wolves in Minnesota, 2017-18. Minnesota Department of Natural Resources, St. Paul.
Fuller, T. K. 1989. Population dynamics of wolves in north-central Minnesota. Wildlife Monographs 105.
Fuller, T. K., W. E. Berg, G. L. Radde, M. S. Lenarz, and G. B. Joselyn. 1992. A history and current estimate of wolf distribution and numbers in Minnesota. Wildlife Society Bulletin 20:42-55.
Fuller, T. K., L. D. Mech, and J. F. Cochrane. 2003. Wolf population dynamics. Pages 161-191 in L.
Gese, E. M., P. A. Terletzky, J. D. Erb, K. C. Fuller, J. P. Grabarkewitz, J. P. Hart, C. Humpal, B. A. Sampson, and J. K. Young. 2019. Injury scores and spatial responses of wolves following capture: cable restraints versus foothold traps. Wildlife Society Bulletin 43: 42-52.
Manly, B. F. J. 1997. Randomization, bootstrap and Monte Carlo methods in biology. Chapman and Hall, London.
Minnesota Department of Natural Resources. 2001. Minnesota wolf management plan. Minnesota Department of Natural Resources, St. Paul.